Lab 5 - Scaling Up
Sally has managed to resolve application performance and stability issues with her knowledge accquire through Calm Blueprints and with application automation she has also helped "bridge" the gap between the Developer and Infrastructure teams. However, in recent months, the infrastructure team has seen a surge in tickets requesting on VM resource expansion. Some of these request occurs over the weekends and some even in the late hours of workdays. As Sally has a track record of resolving some critical issues in their IT operations, she has been tasked to look into the problem.
Sally discovers that there are two main issues that causes the surge in tickets logged:
High CPU usages on the Engineering VMs is causing high latency in user experience. The bad experience is causing ITOps to have to work over the hours to resolve the issues.
High peak traffic on the Web Farm is causing bad experiences on the users. Resulting in lost revenue, peak period are also unpredictable, making ITops unable to cope with the demand.
X-Play
X-play is an easy to use automation tool that helps you to automate routine tasks, and auto-remediate issues that may occur in your system. You can achieve this automation by creating Playbooks.
Playbook allows you to define a trigger that results in the execution of an action or a series of actions. A trigger may be an event that occurs in the system, such as an alert or a request made by you. The resultant actions that you configure can be VM actions, communication actions, alert actions, or report actions.
Scaling out a VM resource
In this exercise, we setup a playbook to automate scale out on the vCPUs of a VM, resolve an alert automatically and then sends a notification message to Slack. Although in this lab this capability is demonstrated on a single VM, they can be applied across to a group of VMs based on their categories.
Integrating Slack
Before we start creating alerts and playbooks in Prism Central, let's get integrate Slack into Prism Central.
Creating a Slack application
Go to https://api.slack.com/apps If you do not have an account, please create an account and sign in.
Click Create an App.
Choose From scratch and give a name to the app.
- App Name: e.g NTNX_Msg (or any random name you wish)
- Pick a workspace to develop your app in: - select your workspace you define
- Click Create App
In the Basic Information menu, do the following:
- Click Add features and functionality
- Click Permissions > Scope >
- User Token Scopes: chat:write
Back to *Basic Information** menu, do the following:
- Click Install to Workspace, under Install your app.
- Once the page is being re-directed to My Workspace authorization page.
- Click Allow
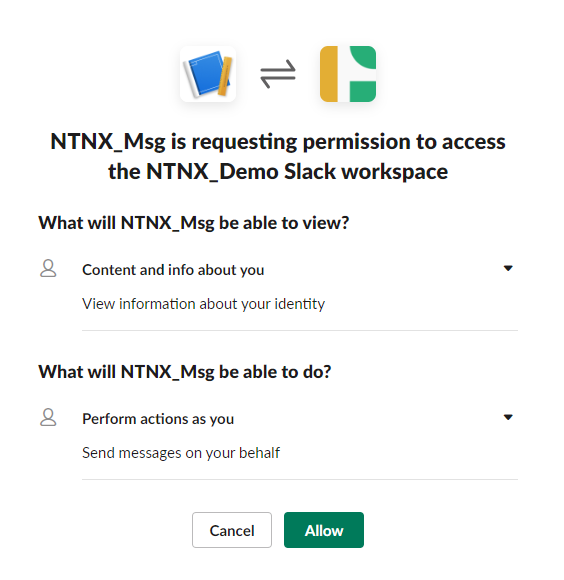
The purpose of this is to obtain the authorisation token.
- Go to the Install app
- Note the OAuth Token for Your Workspacetoken, as you will be needing it for the next lab.
You will be using this token each time you use the Slack action in playbook.
Create a channel from your workspace as the sceenshot below:
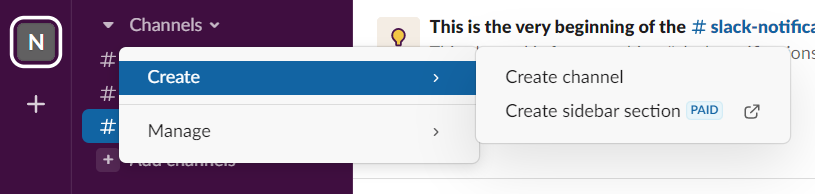
Name your slack channel as: "Alerts_your-initials"
Create Alert
Now, we will generate a policy that will generate an alert when it detects a constrained VM.
In Prism Central, click Activity > Alerts.
Under Alert Policies > User Defined.
Click Create Alert Policy.
noteThere are already four Windows machine pre-populated in the labs for your exercise. They are label as WinSRV_ST01,ST02, ST03 and ST04 in each cluster.
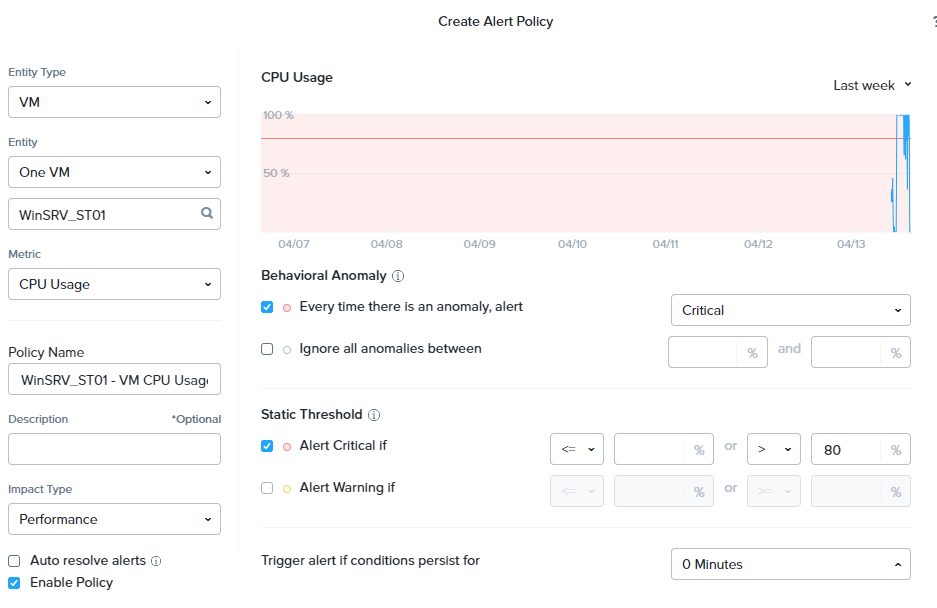
Fill out the fields as follows:
- Entity Type: VM
- Entity: One VM
- WinSRV_ST01 or WinSRV_ST02
- Metric: CPU Usage
You will notice on the right panel of your screen. A CPU Usage policy window opens up.
In the fields below, fill in the following:
- Behavioral Anomaly
- Every time there is an anomaly, alert - Critical
- Static Threshold
- Alert Critical if > 80%
- Trigger alert if conditions persist for: 0 Minutes
- Behavioral Anomaly
- Policy Name: WinSrv_ST01 or 02 High vCPU Usage
- Impact Type: Performance
- Auto resolve alerts - unchecked the tick box
Click Save.
Creating Policy
In Prism Central, click Operations > Playbooks.
Click Create Playbook.
Select Alert.
- Under Select an Alert Policy. Search for the Alert name: WinSRV_ST01 or 02 High vCPU Usage
- Target VM: Specific VMs
- Type WinSRV_ST01/02, depending on your chosen VM
On the left panel, click + Add Action.
- Select VM Recovery Point.
- Target VM: WinSRV_ST01 or 02
On the left panel, click + Add Action.
- Select Power off VM.
- Target VM: WinSRV_ST01 or 02
On the left panel, click + Add Action.
- Select VM Add CPU.
- Target VM: WinSRV_ST01 or 02
- vCPUs to Add: 2
- Maximum Number of vCPUs: 4 Note: we are trying to increase the vCPUs frm 2 to 4.
On the left panel, click + Add Action.
- Select Power On VM.
- Target VM: WinSRV_ST01 or 02
On the left panel, click + Add Action.
- Select Resolve Alert.
- Target Alert: Alert
On the left panel, click + Add Action.
- Select Slack.
This is the stage where you will be utilizating the slack token that you have created earlier.
Under Slack please fill out the following fields:
- Slack Token : copy and paste the User OAuth Token
- Channel Name : your_channel_name
- Copy and paste the following message into the Message field.
The following VM has vCPUs increase from 2 to 4.
- Select Slack.
This is the stage where you will be utilizating the slack token that you have created earlier.
Under Slack please fill out the following fields:
Click Save & Close
- Name:
- Playbook Status - please ensure you check to enable the playbook.
Testing your Playbook.
Now this is the time to test the playbook which you just created.
In Prism Central, go to Compute & Storage > VMs
Click on your allocated machine e.g WinSRV_ST01 or WinSRV_ST02
Click Launch Console.
Login into the machine with the password: nutanix/4u
At the desktop icon, click HeavyLoad. HeavyLoad is a free stress test tool that enables us to simulate high stress load on the CPU that is need for our exercise.
Once HeavyLoad is open, check on the stress test marker - cpu at the center of the screen.

Click on the green play button at the top left of the window.

You will immediately notice that load of the CPU will increase tremendously.
Minimize the console window and click Metrics in Prism Central window and observe the CPU Usage(%) hitting 100%.
Next, open another Prism Central in a tab in your browser.
Go to Activity > Alerts and wait for the alert to be generated. (it will usually take 5 mins or more)
Once the alert is generated, head back to the VM Metrics browser. Click *Summary and you will notice that the vCPUs has increased from 2vCPUs to 4vCPUs.
Open up your Slack and you will notice a message coming through that says the VM has its CPU increased.
Thats wraps up this exercise!!